Студопедия КАТЕГОРИИ: АвтоАвтоматизацияАрхитектураАстрономияАудитБиологияБухгалтерияВоенное делоГенетикаГеографияГеологияГосударствоДомЖурналистика и СМИИзобретательствоИностранные языкиИнформатикаИскусствоИсторияКомпьютерыКулинарияКультураЛексикологияЛитератураЛогикаМаркетингМатематикаМашиностроениеМедицинаМенеджментМеталлы и СваркаМеханикаМузыкаНаселениеОбразованиеОхрана безопасности жизниОхрана ТрудаПедагогикаПолитикаПравоПриборостроениеПрограммированиеПроизводствоПромышленностьПсихологияРадиоРегилияСвязьСоциологияСпортСтандартизацияСтроительствоТехнологииТорговляТуризмФизикаФизиологияФилософияФинансыХимияХозяйствоЦеннообразованиеЧерчениеЭкологияЭконометрикаЭкономикаЭлектроникаЮриспунденкция |
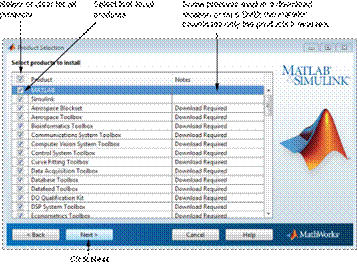
Step 8: Specify Products to Install⇐ ПредыдущаяСтр 24 из 24 From the product list, specify the products you want to install. The list shows all the products associated with the license you selected or with the Activation Key you specified. If you do not want to install a particular product, clear the check box next to its name. Note: If the products you select exist in your computer's default download location or on DVDs, the installer uses the local files for installation instead of downloading them from the MathWorks website. The installer checks if any of the products you selected depend on other products. If there are product dependencies that are not satisfied, the installer issues a warning. Consider adjusting your product selection.
After selecting the products to install, click Next to continue with the installation. Step 9: Confirm Your Choices Before it begins installing the software on your hard disk, the installer displays a summary of your installation choices. To change a setting, click Back. To proceed with the installation, click Install. Note: Depending on the method of installation that you use, the confirmation information can vary from the example shown here.
Step 10: Complete the Installation When the installation successfully completes, you can choose to activate the software you just installed. You cannot use the software you installed until you activate it. Activating immediately after installation is the quickest way to start using MATLAB. Click Next to proceed with activation. If you choose to exit the installer without activating the software, clear the Activate MATLAB option and click Finish (the button label changes). Use the activation application to activate the software at a later time. If you have not activated the software, the activation application starts automatically when you start MATLAB.
Activation Activation for this procedure is the same as activation for Licensed end users. For more information, see Activate an Installation Using a MathWorks Account. Creating matrices and first plots
Objectives: Getting started on learning alternatives how to efficiently create large matrices.
Rationale: Three-by-three matrices are fine examples when studying most theoretical aspects in linear algebra. In realistic applications thirty-by-thirty (or even 3000 by 3000) matrices are not at all uncommon. Nobody would want to enter these by hand, component by component. 1. The graph of a(scalar)function(of one variable): Recall making a table of function values (by hand or EXCEL), plotting it point by point, connecting the dots. In MATLAB it is done in a way very similar to EXCEL: First create a vector (a column) of x-values, then apply the function f to each x value and obtain a vector (another column) of y-values (ALERT: most mathe-maticians cringe at the application of the function f to a vector). Plot one vector (column) against the other. 
Task (10 min): Check the help for plot. Create a plot for a function like sin or x->x^2 using 500 data points (pick your favorite function). Expect trouble with the differences between .*and*or ./and /or .^2 and^2. This may take some time! For fun try out various plot styles (like 'r-', 'yo', or 'c*'). Prepare one presentation per team -- a team representative will be chosen at random to explain the steps.
2. Creating matrices: MATLAB essentially recognizes only one data structure: EVERYTHING is a matrix!
You know how to type in a matrix component-by-component. For the graph using 500 points this was out of question -- you used ranges! In the first class using MATLAB you learnt a few special commands like zeros, eyethat make matrices. But there are many more -- and we will need many of them! (check out hilbert,magic, meshgrid......)
Task(10 min) (Team-to-team competition) Find as many, essentially distinct, ways to create (usually large) matrices as possible. 12 is a good target! Homework (in teams): Find even more ways -- try to get at least twenty.
|
||
|
Последнее изменение этой страницы: 2018-04-12; просмотров: 790. stydopedya.ru не претендует на авторское право материалов, которые вылажены, но предоставляет бесплатный доступ к ним. В случае нарушения авторского права или персональных данных напишите сюда... |


