|
Студопедия КАТЕГОРИИ: АвтоАвтоматизацияАрхитектураАстрономияАудитБиологияБухгалтерияВоенное делоГенетикаГеографияГеологияГосударствоДомЖурналистика и СМИИзобретательствоИностранные языкиИнформатикаИскусствоИсторияКомпьютерыКулинарияКультураЛексикологияЛитератураЛогикаМаркетингМатематикаМашиностроениеМедицинаМенеджментМеталлы и СваркаМеханикаМузыкаНаселениеОбразованиеОхрана безопасности жизниОхрана ТрудаПедагогикаПолитикаПравоПриборостроениеПрограммированиеПроизводствоПромышленностьПсихологияРадиоРегилияСвязьСоциологияСпортСтандартизацияСтроительствоТехнологииТорговляТуризмФизикаФизиологияФилософияФинансыХимияХозяйствоЦеннообразованиеЧерчениеЭкологияЭконометрикаЭкономикаЭлектроникаЮриспунденкция |
Working with Network Monitor
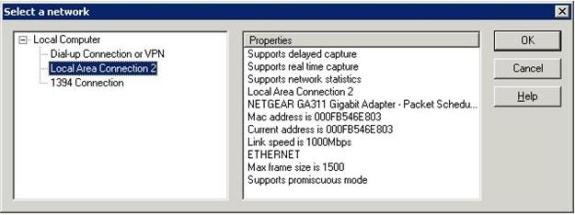
There are two different versions of Network Monitor. For the purposes of this article, I will be using the full version that comes with SMS Server 2003 with Service Pack 1. The Network Monitor Interface When you launch Network Monitor, the first thing that you will see is a message asking you to select the network interface on which you want to capture data. This is important, because if you neglect to select an interface, then Network Monitor will pick one for you, and it might not chose the interface that you would have chosen. Click OK, and you will be taken to a screen that is similar to the one that is shown in Figure A. Simply select the network interface that you want to use and click OK.
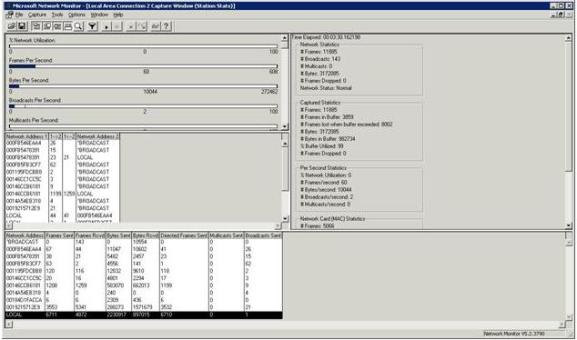
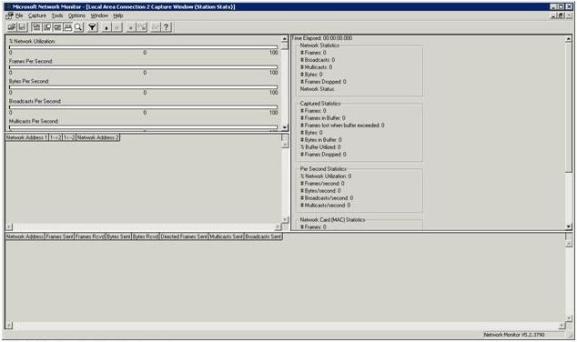
At this point, the Network Monitor will display the main capture screen, shown in Figure B. Before I show you how to use this screen, I just want to mention that Network Monitor only prompts you to select the network that you want to monitor the first time that you use it. If your computer only has one network adapter, then this will not be a problem. If your system is multihomed though, you will probably want to be able to monitor traffic across all of the network segments.
Unfortunately, you cannot monitor traffic across multiple segments simultaneously, but you can switch segments even though Network Monitor does not automatically prompt you for the segment that you want to monitor. To do so, simply select the Networks command from the Capture menu. Doing so will display a screen similar to the one shown in Figure A. The biggest difference between the two screens is that this screen also has a Remote option that you can use for remote packet capturing. Having said that, let’s take a look at the capture screen. As you can see in the figure, this screen is made up of four different panes. The pane in the upper left portion of the window is known as the graph pane. The graph pane graphically displays the current level of activity during the capture process. It contains graphs that display the overall percentage of network utilization, the number of frames captured per second, the number of bytes captured per second, and the number of broadcasts and multicasts per second. You might have noticed in the figure that there is a scroll bar associated with the graph pane. This scroll bar is deceptive because there are no graphs beyond the ones that are shown in the figure. Just below the graph pane is the session statistics pane. The session statistics pane is designed to display a quick summary of the traffic that has been captured. This section displays things like the network addresses of the hosts involved in a conversation, and which host initiated the conversation. The bottom section of the screen contains the session statistics pane. This pane displays capture summary information on a per host basis. The network address of each host is displayed along with the number of frames sent and received, bytes sent and received, and the number of directed frames, multicasts, and broadcasts sent.  The upper right section of the window contains the total statistics pane. As the name implies, this pane displays statistics related to all of the traffic that has been captured as a whole. This pane displays the same types of information as the other panes that I have mentioned. The difference is that the total statistics pane does not break the statistics down on a per host basis. Capturing Network Traffic Now that I have given you a quick orientation of the Network Monitor interface, it is time to capture some network traffic. If you look at Figure B, you will notice the tool bar just above the graph pane. This toolbar is used to control the capture process. The capture related buttons on the toolbar are as follows:
To capture data using the Network Monitor, just click the Capture Data button. Network Monitor will begin capturing data and will not stop until you either pause or stop the capture. The data capture process looks something like the what you see in Figure C.
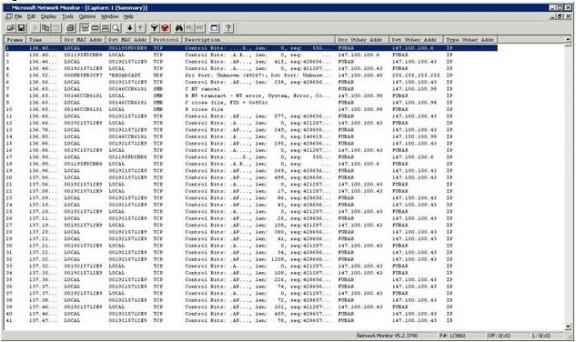
As you look at the figure, the first thing that you will probably notice is that it contains lots of statistics, but no real data. If you want to view the data that has been captured, you will have to click the View Data button on the toolbar. Upon doing so, you will see a screen similar to the one that is shown in Figure D.
If you look closely at the captured data you will notice that what Network Monitor is really displaying is a summary of the individual frames that have been captured. This particular screen lists the frame number, the time that the frame was captured, the source and destination addresses, the protocols used, and things like that, but it does not actually show the data contained within the frame. Fortunately, there is an easy way to view more detailed information. If you look at the toolbar, you will notice three buttons that consist of three rectangles each, as follows
These buttons allow you to toggle the summary pane, details pane, and hexadecimal pane. When all three panes are enabled, you can see a comprehensive view of the selected frame, as shown in Figure E.
As you can see in the figure, the Details pane displays protocol information for the currently selected frame. When a frame contains multiple protocols, the outermost protocol is listed first. The hexadecimal pane displays the actual data that makes up the frame. Notice in the figure that a portion of the frame is selected in the Details pane. The selected portion is then highlighted in the Hexadecimal pane to help you isolate the data. So far in this part, I have shown you some basic techniques for capturing data using Network Monitor. In this part, I want to continue the discussion by showing you how to analyze the data that you have captured.
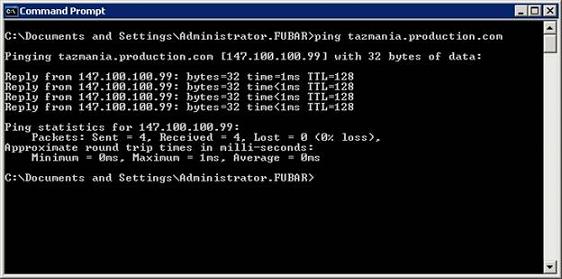
For the purposes of keeping things simple, let’s perform a packet capture against a simple ping operation. To do so, log on to the server that you will be running Network Monitor on, and open a Command Prompt window. When the command prompt window opens, type the PING command followed by a space and the fully qualified domain name or the IP address of a computer on your network, but do not press Enter yet. Now, open the Network Monitor and select the Start command from the Capture menu. Immediately switch over to the Command Prompt window and press Enter to execute the PING command. The command should return four results, as shown in Figure A. As soon as the command finishes executing, switch back to the Network Monitor screen and select the Stop command from the Capture menu. In doing so, you will have captured the packets associated with the PING command, but will likely have captured some unrelated traffic as well.
After you stop the capture process, click the Display Captured Data icon ( The point is that if you were using the Network Monitor to troubleshoot a network problem in the real world, you would almost certainly capture some irrelevant data. Knowing how to sift through this excess data is an essential skill because otherwise locating the data that you are actually interested in could be like looking for a needle in the proverbial haystack. If you look at Figure B, you will notice that there were quite a few packets captured. Our job is to filter the packets that are unrelated to the activity that we were trying to capture so that analyzing the captured packets will be easier.
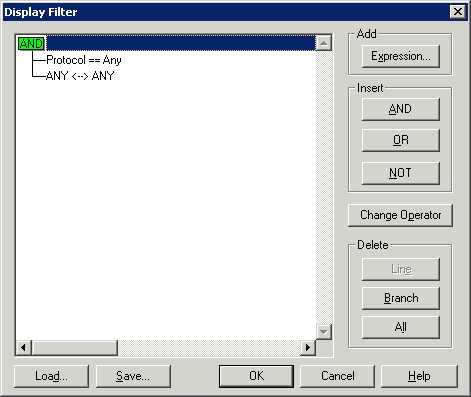
To do so, click the Filter icon found on the tool bar. When you do, you will see a rather intimidating looking dialog box, as shown in Figure C. What this dialog box is telling you is that right now Network Monitor is showing you all of the captured data, regardless of protocol or IP address.
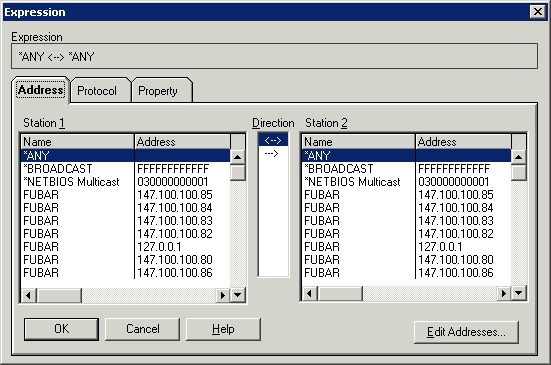
However, we performed a PING from one machine to another, and we know the IP addresses that were involved in the PING. Therefore, we can filter on those addresses. To do so, select the ANY <-> ANY line and click the Edit Expression button. You will now see a screen similar to the one that’s shown in Figure D.
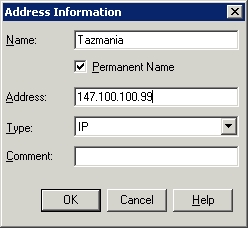
This screen allows you to select the addresses of the two machines involved in the conversation. Normally, you would simply select the source and destination addresses, verify that the direction column was set to <-> and click OK. In this particular case things are a bit more complex. You will notice in the figure that there are multiple IP addresses associated with the machine FUBAR. That’s because this machine is a Web server and is hosting multiple sites, each with their own address. In a situation like this, you would select the machine’s primary address unless you had a specific reason for using one of the other addresses. The other thing that makes this screen a bit difficult is that the address of the destination machine is not displayed. You can fix this by clicking the Edit Addresses button. Doing so will display a list of all of the addresses from the previous list. Click the Add button and you will be given the chance to add an address to the list. Notice in Figure E that you must choose the type of address (IP or MAC) that you are adding. Click OK followed by Close, and the address will be added to the address filter.
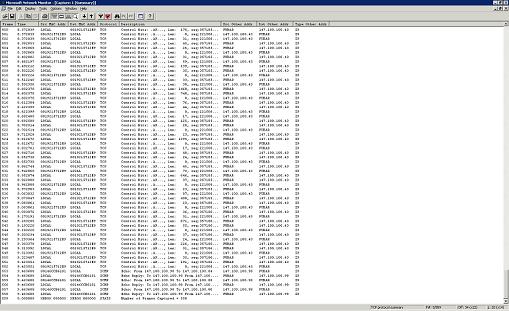
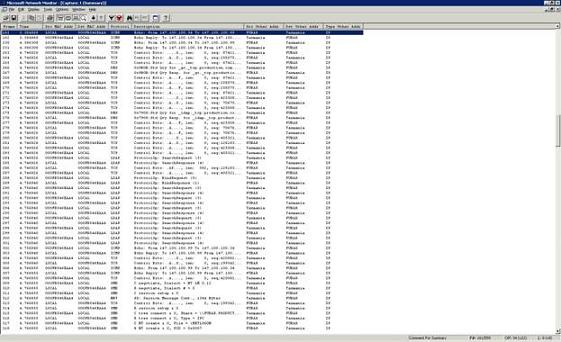
Now select the IP addresses involved in the conversation that you are interested in and click OK twice. The list of captured frames is now filtered to display only traffic from the selected machines, as shown in Figure F.
Since our capture only involved the PING command you shouldn’t have any trouble locating the data that you are looking for. In the real world though, there is a chance that the data that you are trying to capture may not even exist within the capture. There are two primary conditions that can cause this to happen. The first reason why your capture file may not contain the data that you are interested in is because most companies have made the move from hubs to switches. On a network in which hubs are used, every computer on the hub receives the exact same traffic. When a computer needs to communicate with another computer, it places a packet on the wire, and that packet travels to every computer that’s attached to the hub. Each computer looks at the destination address found in the packet header to check to see if the packet is intended for that computer. If the destination address matches the computer’s MAC address then the computer opens the packet and processes its contents. Otherwise the packet is ignored. Things work differently if a switch is involved. When a computer sends a packet, the switch actually looks at the packet header to determine the packet’s intended recipient. The switch then forwards the packet to the switch port that the recipient is attached to. Computers other than the sender and the recipient are completely oblivious to the conversation. The reason why switches have begun replacing hubs is because switches are far more efficient (and more secure) than hubs. If a hub is in use and two computers attempt to transmit data at the same time, a collision occurs, destroying both packets in the process. The two computers each wait a random amount of time before retransmitting the data. The more computers that are attached to a network, the more collisions occur. Of course more collisions mean slower network performance. Therefore, dropping prices and the need for greater performance has driven many companies to make the move to switches. Switches are particularly problematic when it comes to capturing data with Network Monitor. Because of the way that switches work, you will only be able to capture data sent to or from the computer that Network Monitor is running on. Another condition that may lead to the desired packets not being captured is the use of virtual machines. If a single server is hosting multiple virtual machines, then the traffic flowing between those virtual machines will most likely not be captured because traffic between virtual machines hosted by a single server typically does not flow across the wire. It is possible to configure virtual machines so that traffic between them is placed on the network.
Laboratory work № 8
Key Generation Module 1: Getting Started 1. Introducing pan-python 2. API Key Generation 3. Execute Operational Commands Introducing pan-python Pan-python is a multi-tool set for Palo Alto Networks PAN-OS, Panorama, WildFireand AutoFocus. The panxapi.py command line program from pan-python will be used in the PAN-OS XML API labs to perform API requests. Pan-python is hosted on GitHub at https://github.com/kevinsteves/pan-python. Documentation is available as rendered reStructuredText from GitHub and as HTML from the package doc/ directory. Pan -python is available as a package on PyPI (Python Package Index) and can be installed using pip. |
||
|
|
Последнее изменение этой страницы: 2018-04-12; просмотров: 1106. stydopedya.ru не претендует на авторское право материалов, которые вылажены, но предоставляет бесплатный доступ к ним. В случае нарушения авторского права или персональных данных напишите сюда... |
 Capture Data
 Pause the capture or resume a paused capture
 Stop the capture process
 Stop the capture and view the captured data
 View the captured data
 Help
Help