|
Студопедия КАТЕГОРИИ: АвтоАвтоматизацияАрхитектураАстрономияАудитБиологияБухгалтерияВоенное делоГенетикаГеографияГеологияГосударствоДомЖурналистика и СМИИзобретательствоИностранные языкиИнформатикаИскусствоИсторияКомпьютерыКулинарияКультураЛексикологияЛитератураЛогикаМаркетингМатематикаМашиностроениеМедицинаМенеджментМеталлы и СваркаМеханикаМузыкаНаселениеОбразованиеОхрана безопасности жизниОхрана ТрудаПедагогикаПолитикаПравоПриборостроениеПрограммированиеПроизводствоПромышленностьПсихологияРадиоРегилияСвязьСоциологияСпортСтандартизацияСтроительствоТехнологииТорговляТуризмФизикаФизиологияФилософияФинансыХимияХозяйствоЦеннообразованиеЧерчениеЭкологияЭконометрикаЭкономикаЭлектроникаЮриспунденкция |
Microsoft Access. Development of database structure, creation of tables and requests.Security instructions for working with computers: Before turning on of the computer, you must examine the personal computer on integrity of the computer case, that wires don't disturb work and movement; Optimum distance of eyes up to the monitor during working time (60-70 cm.); It is strictly forbidden: To touch to wires, forks, sockets, move of the equipment during working time; To work at the computer wet hands or in wet clothes; To put any subjects or to spill liquids on the computer or the keyboard; At detection of defects in operation of the computer, a smell of burning, you have to stop work, switch off the computer and tell to the teacher. Objective: By the end of this lab, you should be familiar with
LABORATORY TASKS We have been working on data modeling, database management system and Microsoft Access since last week. In this lab session, you will use Microsoft Access to create and link tables, design queries to access data and enter data using forms. The lab session is based on Microsoft 2007 office suite. If you have earlier versions of the Microsoft Access program, the interface will be different. Otherwise, you can use the ECU Virtual Computing Lab to access Microsoft Access 2007. I am going to demonstrate how to use Access 2007 to create the database in class. The session will be recorded and I will make it available online as well. 1. Launch Microsoft Office 2007 Access from the Microsoft Office Suite. Click the Blank Database graph under the New Blank Database. Name the file “ER” and choose a place on your hard drive to save it by clicking on the folder icon. Then click Create button to create the database.
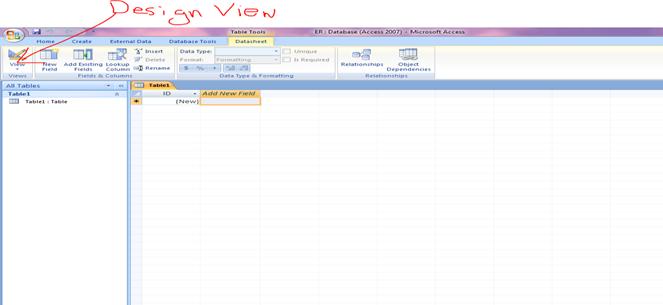
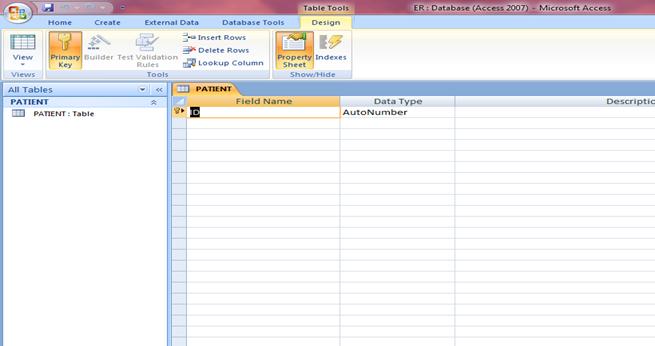
In the design view, please add additional fields to finish the table. The field names and data types for the PATIENT table is listed in Appendix A. You need to create two tables – PATIENT and ENCOUNTER. Please see Appendix A for the name and property of each field. Pay attention to the field size and data type of each field. Use Lookup Wizard to define the value of Arrival_Mode in the PATIENT database. You need to define two columns with the first column as the code and the second column as explanations. The code and descriptions are as follows: 01 – Emergency Ambulance 02 – Patient Transport Service 03 – Public Transport 04 – Private Transport 05 – Walking 06 – Police Transport 07 – Prison Transport 98 – Other 99 – Not Known. You can keep the original primary key ID automatically added by Microsoft Access, or you can remove the default primary key and make two new ones like I did in Appendix A. If you keep the old primary keys, make sure you name them MR_NO (in both tables) and ENCOUNTER_ID. Keep the data type as AutoNumber is OK.  After creating the two tables, your Table work pane should look like this.
3. Click on the Database Tools tab on the Ribbon. Click Relationships to bring up the dialog for choosing table to build relationships. Add both PATIENT and ENCOUNTER tables to the relationship window. Then close the dialog. Clicking the MR_NO field within the PATIENT table, without release, drop it over the MR_NO within the ENCOUNTER table. A new Edit Relationships Window will appear. Make sure you check “Enforce Referential Integrity”.
After clicking Create button, you can see the two tables are linked with each other.
4. Create forms for viewing and entering data into the two tables. Click on the Create Tab on the Ribbon then More Forms button within the Forms section, choose Form Wizard to create Forms.
Choose Table: ENCOUNTER from the Table/Queries drop down list. Click the
Click “Next”. Select the layout that you prefer to use for your form. The default one is Columnar. Choosing different option will give you the preview of different layout.
Click Next. Select the style you prefer from the subsequent window. Choosing different options will give you the preview of the style.
Click Next. Name the form Encounter. Choose Modify the Form’s Design, then press Finish.
You should see the form design interface like the image below. You can click on a data entry field to highlight. Feel free to resize or move any entry field to accommodate potential data after you create the datable.
Press the
Follow the same step to create another form for the PATIENT table. 5. Now you have the two forms to enter data into the data tables PATIENT and ENCOUNTER. Populate some fictional data into the database through the two forms. You need to populate the PATIENT table first, then the ENCOUNTER table. Please note that the MR_NOs in the ENCOUNTER table must exist in the PATIENT table first. At the bottom of the form (in view mode), you can see a row of buttons like Enter three patients and 5 encounters for query practice in next step. Please have one encounter with the Arrival_Mode as Walking since we are going to use it in our next step. 6. Query data from the database. Now you have data in the Access database. You can use query to retrieve the data as you needed. For example, you might be interested in listing all patients who walked into the ER. Microsoft Access uses the method Query by Example (QBE) to visually display the query. First, you need to click the Query Design button on the Create tab to access the Queries work space.
Click Create query in Design view. You should be able to see the query design view and the Show Table window.
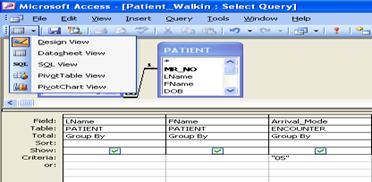
Add two tables to the Query Design view by highlighting the table and press Add button. Close the Show Table window once you have both tables added. In the first field, choose PATIENT.LName. In the second field, choolse PATIENT.FName. In the third filed, choose ENCOUNTER.Arrival_Mode. For the Field ENCOUNTER.Arrival_Mode, enter = “05” into the Criteria cell.
Save the Query as Patient_Walkin. Press the run
Press the SQL view from the dropdown list to view the SQL code behind the scene.
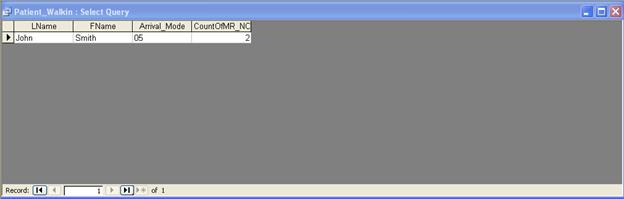
Other than listing the patients meet the criteria, Microsoft Access can also perform simple calculation. For example, you want to count the number of patients walked in the ER. You can use the count expression in Microsoft Access query to calculate the data. Add the one more field PATIENT.MR_NO to the query design view. Press the
Change the Total cell for the field MR_NO to Count from the drop down list.
Now run the query again. You can see my patients walk in the ER twice.
The query we just did is called select query. There are other types of queries available in Microsoft Access. Click on the Appendix A: Documentation of the ED database. Table: ENCOUNTER
Table: PATIENT
Patient_ID Text 10 LName Text 50 FName Text 50 DOB Date/Time 8 Gender Text 6 Street_Address Text 50 Apart_Number Text 10 City Text 50 State Text 2 Zipcode Text 5 Insurance Code Text 10 QUESTIONS 1. Key field - it's ... 2. Describe the process of creating and assigning "Lookup Wizard" 3. Indexed field - it's ... 4. Appointment of the indexed field. 5. Describe the process of creating a table in the constructor 6. Request for a sample - a ... REFERENCES 1. http://www.w3schools.com 2. www.youtube.com
Practical work № 5 Security instructions for working with computers: Before turning on of the computer, you must examine the personal computer on integrity of the computer case, that wires don't disturb work and movement; Optimum distance of eyes up to the monitor during working time (60-70 cm.); It is strictly forbidden: To touch to wires, forks, sockets, move of the equipment during working time; To work at the computer wet hands or in wet clothes; To put any subjects or to spill liquids on the computer or the keyboard; At detection of defects in operation of the computer, a smell of burning, you have to stop work, switch off the computer and tell to the teacher. Theme :Design and creation of the presentations of lecture material, scientific reports, etc. Aims : 1. To introduce the basics of design and creation of presentation. 2. After the lab to be able to create the presentation of lecture or something else. 3. To teach how to create a maximum impact and persuade the audience through presentation that can amplify the message. Theory: A slide is a single page of a presentation. A presentation is the process of presenting a topic to an audience. It is typically a demonstration, introduction, lecture, or speech meant to inform and persuade. In presentation the tables, diagrams from excel could be placed, animation used and design of the presentation changed. For creating presentation different programs can be used such as MS Office PowerPoint, Prezi, Keynote, etc. The good presentation of lecture material, scientific report, etc. should have features shown below. The audience is to be known, for novice learners’ a topic, context and complex information are to be clarified (if needed). In introduction include a statement of the intended goals or outcomes of the lecture-a definition of what you want the audience to know or be able to do as a result is to be included. Some lecturers also like to provide the audience with a list of key terms that will be included in the presentation. The body has core content. As the presentation is scientific it almost always has graphs, diagrams, pictures and tables, however slides with dense graphics will distract or confuse your audience. There are no perfect rules to creating effective slides beyond this one: Keep it simple. When building your slides, make sure that only one point appears at a time. The conclusion should include a summary of the material you covered in the lecture. The lectures have suggestions on how best to follow-up on the lecture, including additional readings, assignments and problem-sets. Questions are a vital part of any lecture or presentation and provide opportunities for the whole audience to clarify and develop their understanding of the material. It is important to treat the question and answer session as a formal part of the presentation that requires as much careful planning and control as the delivery of the core material. It is good to repeat the question for the whole audience. While making slides, do · Use high quality photographs or images that pop · Avoid sound effects, distracting backgrounds · Use sans-serif or other good fonts, as they are easier to read. Keep the number of fonts in your presentation to a bare minimum. · Emphasize text with italics rather than underlining. Underlines can obscure letters and make text difficult to read. · Use a large font size, from 28 to 40. This limits the number of words on slide. · Cite your sources. Also, the use of point-by-point highlights and simplified animations, jumps with a click, zoom and pan is not prohibited. You should spend about 2 minutes per slide. A change every 2 minutes is great because it helps the audience refocus. LABORATORY TASKS Make a presentation using the theory and specification above on the topic given by Professor or TAs. You can use any branch and narrow the topic. The maximum number of slides is 10. INDIVIDUAL TASKS
I. The methods and tools for security and administration of network. II. Hardware and software technology that is used to interconnect III. Large-scale networking IV. Artificial Intelligence and robotics V. Computer-assisted education VI. Boolean algebra VII. Copyright and confidentiality rules in the Internet VIII. Peer-to-peer file sharing IX. Human-computer interaction X. Programming languages and environments XI. Overview of Database Security
QUESTIONS 1. Power Point is… 2. How to show slides? 3. What applies to multimedia 4. What is the expansion of the presentation file? 5. how to save a file? REFERENCES 1. Матросов А., Сергеев А., Чаунин М. HTML 4.0- Санкт-Петербург, из. BHV (в подлиннике) 2. В.Холмогоров. Основы Веб-мастерства. – Питер, 2010. 3. http://www.w3schools.com/html/default.asp 4. http://www.w3schools.com/css/default.asp 5. www.youtube.com
Laboratory work № 6 Security instructions for working with computers: Before turning on of the computer, you must examine the personal computer on integrity of the computer case, that wires don't disturb work and movement; Optimum distance of eyes up to the monitor during working time (60-70 cm.); It is strictly forbidden: To touch to wires, forks, sockets, move of the equipment during working time; To work at the computer wet hands or in wet clothes; To put any subjects or to spill liquids on the computer or the keyboard; At detection of defects in operation of the computer, a smell of burning, you have to stop work, switch off the computer and tell to the teacher. LEARN“Processing of numerical information, editing formulas and creation of charts in plate editors” THE PURPOSE OF LABORATORY WORK –getting by students of skills of working in Excel 2007 LEARNING MATERIALSyou can see in “ICT_lab6” folder - “New_Excel_2007_Quicktip.pdf”. LABORATORY TASKS 1. Open a blank workbook (Start – All programs – MS Excel 2007). 2. Write the following entries into the specified cells:
C2 : Annual Fruit Sales B3 : 1999 A4 : Apple F3 : Total C3 : 2000 A5 : Orange G3 : Average D3 : 2001 A6 : Banana E3 : 2002 B4 : 1000 B5 : 2300 B6 : 500 C4 : 1250 C5 : 2500 C6 : 300 D4 : 800 D5 : 1200 D6 : 600 E4 : 1300 E5 : 1450 E6 : 250
3. Merge the cells from A2 to G2. Apply the following changes to the title line: · Change the horizontal and vertical text alignments as center. · Change the row height of row 2 as 25. · Change the font, font size, font style and font color as Tahoma, 18, bold, blue. 4. Using range selection, select the cells from B3 to G3. Then press Ctrl key on the keyboard and select the cells from A4 to A6. (this way you can select multiple cells on different parts of the worksheet). Now change the font, font size and font style of the selected cells as Times New Roman, 12, bold-italic. 5. Using the AutoSum feature, find and write the sum of cells from B4 to E4 into cell F4. Then copy this cell to F5 and F6. (Hold the right bottom of F4 and drag it to F5 and F6) Observe that the formulas are updated when copied. 6. Using the Average function find and write the average sales of apple over years into cell G4. (Excel will suggest a range automatically to you, however this range will be wrong. So you will have to select the range yourself) Using the same method in the previous question, copy this cell to G5 and G6. 7. Add a comment to G4. Write the text “Average sales over years” into the comment box. 8. Select the cells from B4 to G6. Change format of the selected cells to Currency with Symbol TL and 3 decimal places. 9. Change the column width of Column A such that all the texts on this column can fit into the cells. 10. Select the columns from B to G and apply AutoFit Selection for these columns. 11. Add a new row above the 3rd row (that is between rows 2 and 3). 12. Add outside and inside borders to your table. For the ouside border choose a thicker line. (To add borders, select the range where you want to add borders (that is from A2 to G7), then choose Format Cells from the shortcut menu and click the Border tab) 13. Select the title (select the merged cell in row 2) and change the cell color to yellow. (To change cell color, from the shortcut menu select Format Cells, then click Pattern tab) 14. Select the cells B4 to G4 and A5 to A7 (Use Ctrl key). Change the cell color as pink. 15. Select the cells from B5 to G7. Change the cell color as light blue. 16. Using Print Preview feature, observe how your document would appear on a printed sheet. Add one of the automatic headers to the header. Add the page number to the footer of the document. Change the page orientation as Landscape. (Use the setup menu in the Print Preview mode to add header&footer and change page orientation) 17. Select the cells from B5 to G7. Click on the Chart Wizard button. Select Column chart type and the first chart sub-types. Write “Annual Fruit Sales” as the Chart title, “Year” as the Category (X) axis, “Value” as the Category (Y) axis. 18. Move the legend to the bottom of the chart. (Right-click on the legend area and choose Format Legend, then select Placement) 19. Change the pattern of the Chart Area. Select any of the patterns you like from the Texture patterns. (Right-click on the Chart area, choose Format Chart Area, then click on Fill Effects and select Texture tab).
INDIVIDUAL TASKS 1. Make the following tasks:
QUESTIONS 6. How you can sum up the Rows and Column number quickly in the excel sheet? 7. How you can add a new excel worksheet? 8. ow can you format a cell? What are the options? 9. What is the difference between function and formula in MS-Excel? 10. What is Chart in MS-Excel? Why is it important to you an appropriate chart? REFERENCES 3. http:/www.tlc.housing.wisc.edu/feedback.php 4. http://www.worldbestlearningcenter.com/index_files/excel-exercise-highlight-advanced.htm 5. http://www.w3schools.com 6. www.youtube.com
Laboratory work № 7 |
||||||||||||||||||||||||||||||||||||||||||||||||||||||||||||||||||||
|
|
Последнее изменение этой страницы: 2018-04-12; просмотров: 3551. stydopedya.ru не претендует на авторское право материалов, которые вылажены, но предоставляет бесплатный доступ к ним. В случае нарушения авторского права или персональных данных напишите сюда... |


 in the center of the Form Wizard windows to move all fields from the left side of the window to the right side of the window. You can also use
  to move the fields one by one.
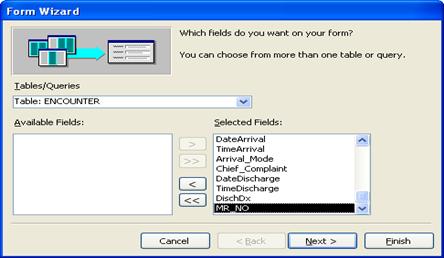


 .
. button on the left upper corner to toggle the mode to view form. You can see all your fields are listed in a column layout. Please note the form automatically designed the Arrival_Mode as a drop down list since we used Lookup wizard in our table design. There is no need to enter any data here yet.
 . It is the record navigation bar allows you to go to the beginning of the records, backward one record, forward one record, , go to the last record, and enter news record.


 button on the Query Design toolbar to run the query. The result of my query is as follows. Press the SQL view from the dropdown list

 button on the query design toolbar to display the row Total.


 .
. button on the query design toolbar to view the choice of other query. It is not required in this session to design other type of queries, but feel free to try those.